Waste Analysis Data Visualization
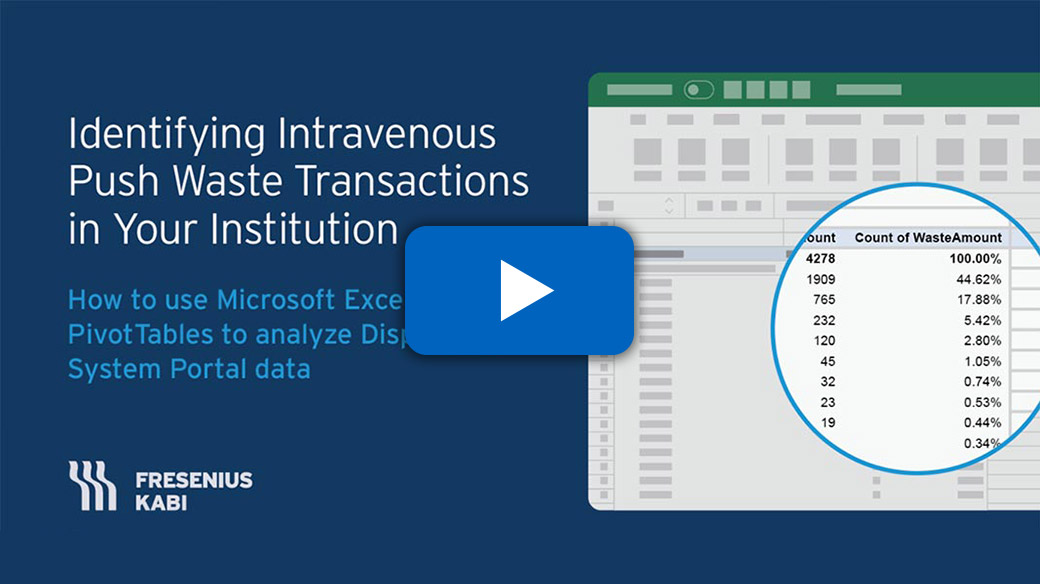
Identifying intravenous push waste transactions in your institution.
To get a more focused look at the waste activities that occur in your institution, you can independently generate reports from your automated dispensing system, which will provide the necessary information to populate Waste Analysis Data Visualization chart in this next step.
We've created a video tutorial that will walk you through the steps needed.
Once you have the necessary data points scroll or navigate to next section.
Support Materials > Analyze your Data > Waste Analysis Data Visualization
Potential Impact
Fentanyl
Estimated waste
event transaction
0 transactions
Annualized reduction in waste events
0 hours
Estimated annual time saved wasting**
Hydromorphone
Estimated waste
event transaction
0 transactions
Annualized reduction in waste events
0 hours
Estimated annual time saved wasting**
Morphine
Estimated waste
event transaction
0 transactions
Annualized reduction in waste events
0 hours
Estimated annual time saved wasting**
Revise data input
Download your Toolkit as a powerpoint presentation with your customized data above.
Created for Institution Name
By Firstname Lastname
Fresenius Kabi USA, LLC © 2024. Simplist® is a registered trademark of Fresenius Kabi USA, LLC.
Potential Impact at Institution Name
Fentanyl
Estimated waste
event transaction
13,644 transactions
Annualized reduction in waste events
289 hours
Estimated annual time saved wasting**
Hydromorphone
Estimated waste
event transaction
21,724 transactions
Annualized reduction in waste events
460 hours
Estimated annual time saved wasting**
Morphine
Estimated waste
event transaction
1,348 transactions
Annualized reduction in waste events
29 hours
Estimated annual time saved wasting**
*Calculated using workforce time wasted per event of 76.2 seconds in Hertig et al.
Hertig, J. et al. (2020). A continuous Observation Workflow Time Study to Assess Intravenous Push Waste. Hospital Pharmacy.
Preparing your powerpoint...